
当前位置:首页 >
商务沟通方法与技能(11742) > 正文内容
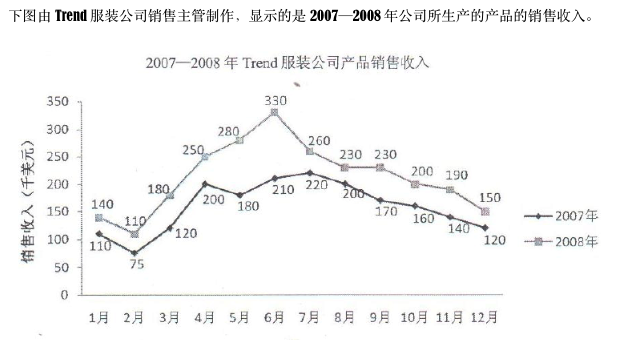 请解释上图显示的趋势
 请解释上图显示的趋势
1.2008年的销售收入高于2007年。2.自二月中旬起,销售收入开始增长,几个月后,销售收入逐步下降。

扫描二维码免费使用微信小程序搜题/刷题/查看解析。
版权声明:本文由翰林刷题小程序授权发布,如需转载请注明出处。